- Precondition
- Sequence Diagrams
- Flowcharts
- Mermaid
- Save-as / Copy on Diagrams
Precondition
Typora supports some Markdown extensions for diagrams, to use this feature, first please enable Diagrams in Preferences Panel → Markdown section.
When exporting as HTML, PDF, epub or docx, those rendered diagrams will also be included, but diagram features are not supported when exporting Markdown into other file formats in the current version. Also, you should note that diagrams are not supported by standard Markdown, CommonMark or GFM. Therefore, we still recommend you to insert an image of these diagrams instead of writing them in Markdown directly.
Sequence Diagrams
This feature uses js-sequence, which turns the following code block into a rendered diagram:
```sequence
Alice->Bob: Hello Bob, how are you?
Note right of Bob: Bob thinks
Bob-->Alice: I am good thanks!
```
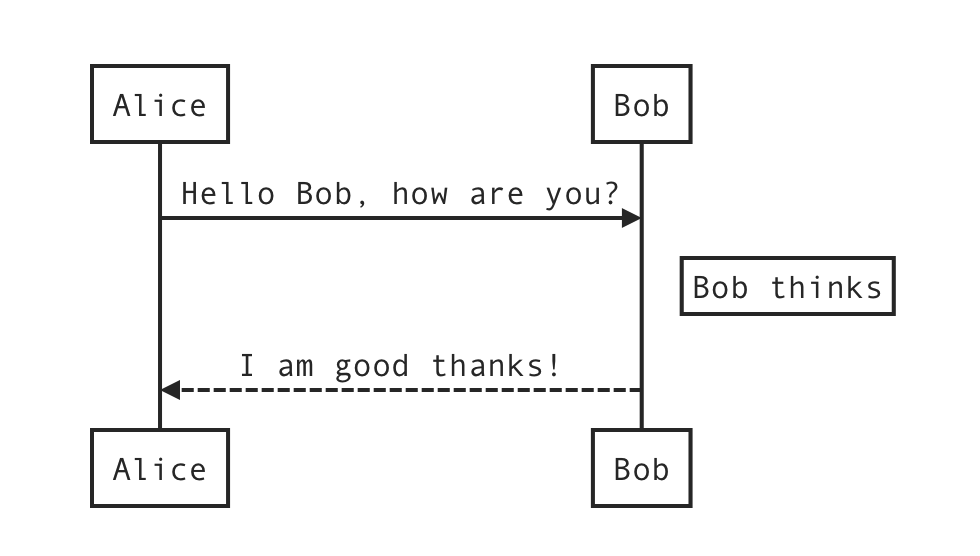
For more details, please see this syntax explanation.
Sequence Diagrams Options
You can change the CSS variable --sequence-theme to set the theme for sequence diagrams, supported values are simple (default) and hand. For example, add the following CSS in Custom CSS, and you will get:
:root {
  --sequence-theme: hand
}
| –sequence-theme: simple | –sequence-theme: hand |
|---|---|
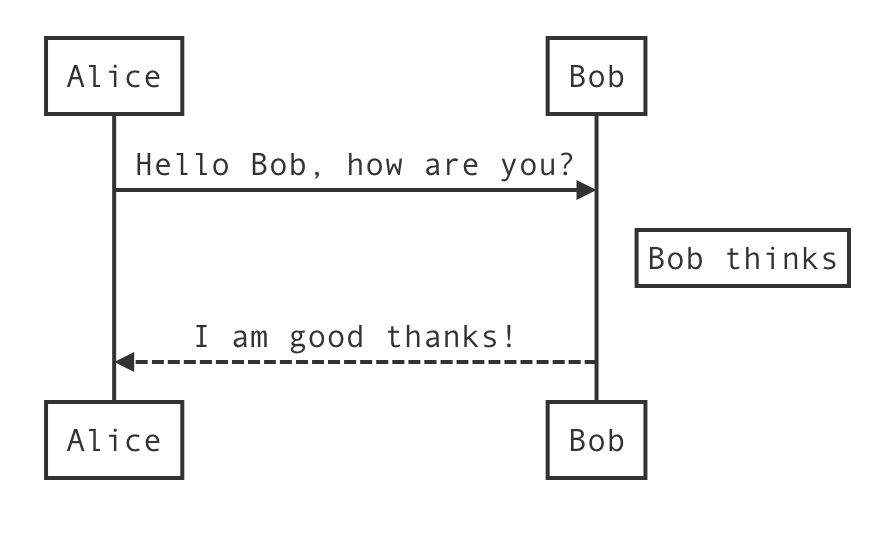 |
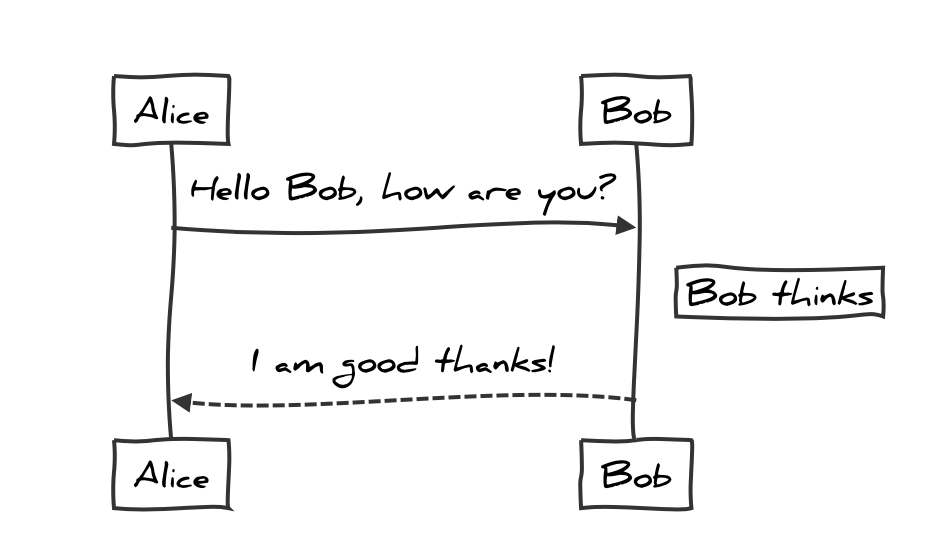 |
Flowcharts
This feature uses flowchart.js, which turns the following code block into a rendered diagram:
```flow
st=>start: Start
op=>operation: Your Operation
cond=>condition: Yes or No?
e=>end

st->op->cond
cond(yes)->e
cond(no)->op
```

Mermaid
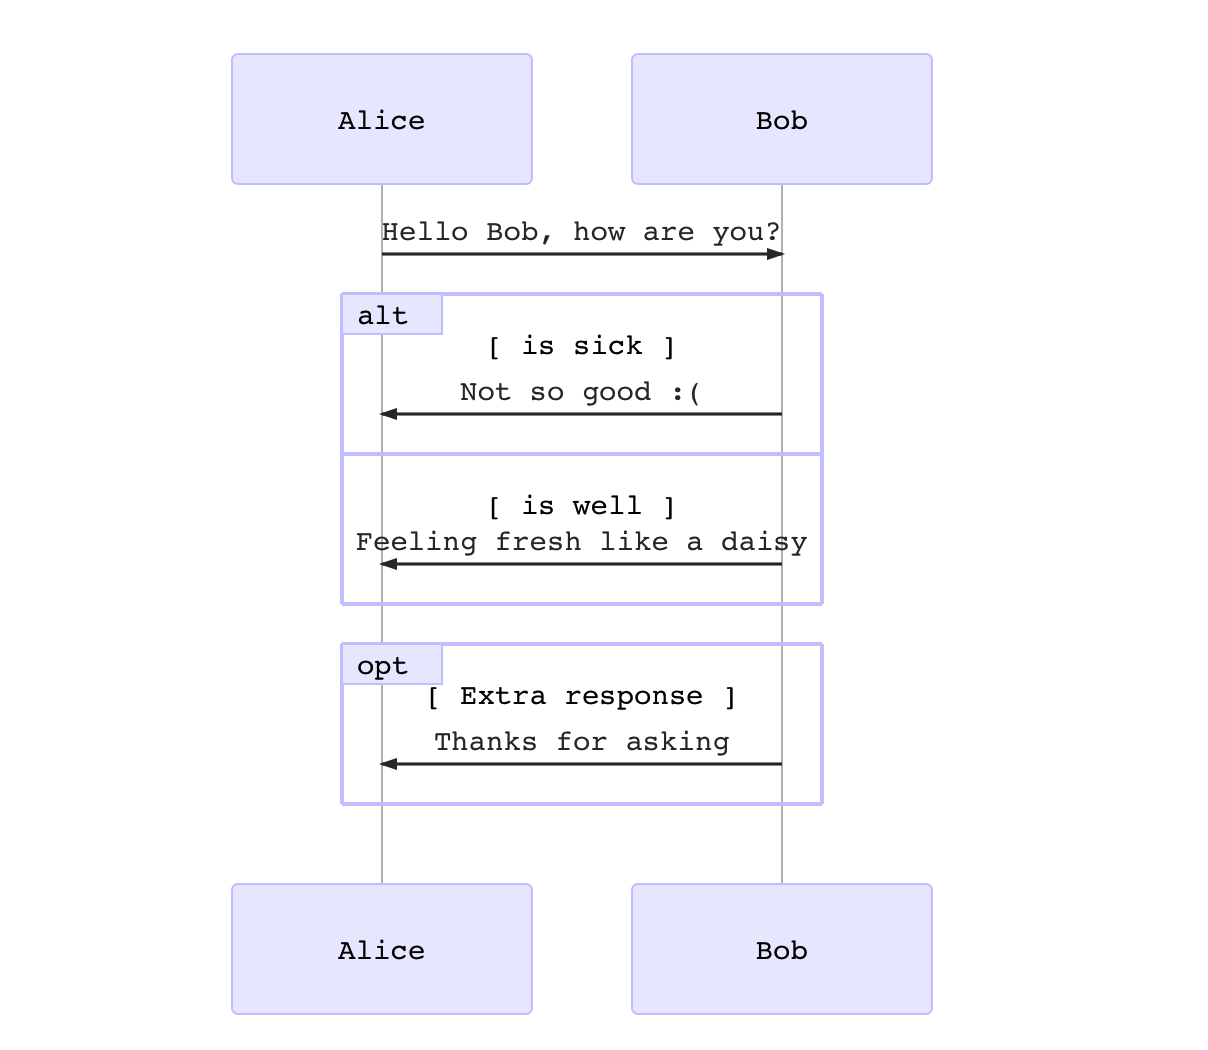
Typora also has integration with mermaid, which supports sequence diagrams, flowcharts, Gantt charts, class and state diagrams, and pie charts.
Sequence Diagrams
For more details see these instructions.
```mermaid
%% Example of sequence diagram
  sequenceDiagram
    Alice->>Bob: Hello Bob, how are you?
    alt is sick
    Bob->>Alice: Not so good :(
    else is well
    Bob->>Alice: Feeling fresh like a daisy
    end
    opt Extra response
    Bob->>Alice: Thanks for asking
    end
```
Flowcharts
For more details see these instructions.
```mermaid
graph LR
A[Hard edge] -->B(Round edge)
    B --> C{Decision}
    C -->|One| D[Result one]
    C -->|Two| E[Result two]
```

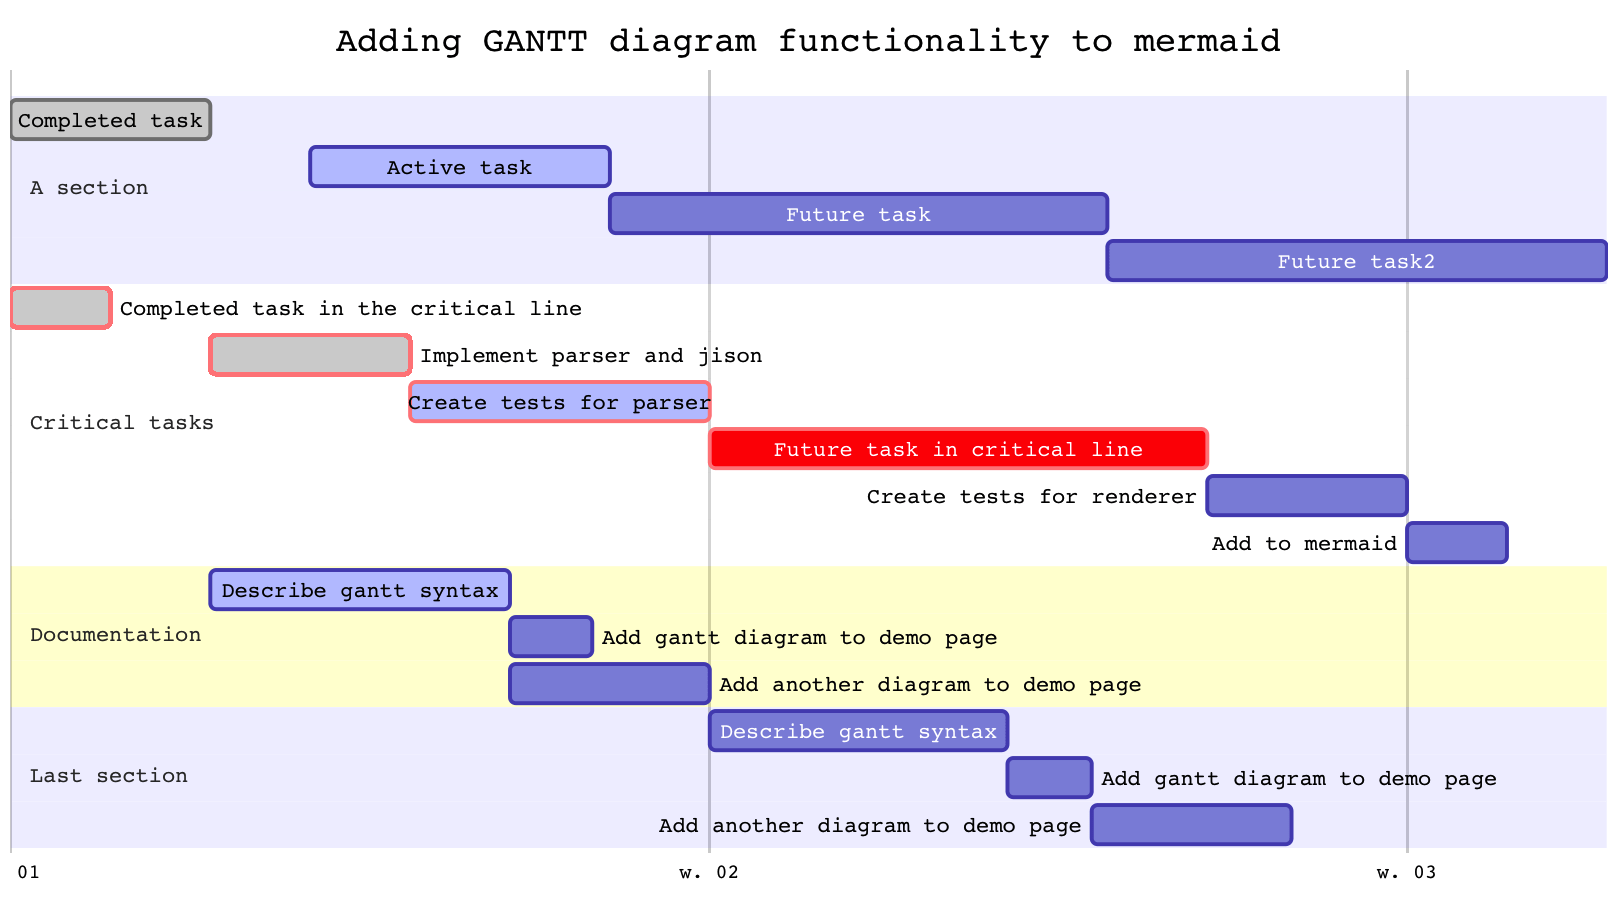
Gantt Charts
For more details see these instructions.
```mermaid
%% Example with selection of syntaxes
        gantt
        dateFormat  YYYY-MM-DD
        title Adding GANTT diagram functionality to mermaid

        section A section
        Completed task            :done,    des1, 2014-01-06,2014-01-08
        Active task               :active,  des2, 2014-01-09, 3d
        Future task               :         des3, after des2, 5d
        Future task2               :         des4, after des3, 5d

        section Critical tasks
        Completed task in the critical line :crit, done, 2014-01-06,24h
        Implement parser and jison          :crit, done, after des1, 2d
        Create tests for parser             :crit, active, 3d
        Future task in critical line        :crit, 5d
        Create tests for renderer           :2d
        Add to mermaid                      :1d

        section Documentation
        Describe gantt syntax               :active, a1, after des1, 3d
        Add gantt diagram to demo page      :after a1  , 20h
        Add another diagram to demo page    :doc1, after a1  , 48h

        section Last section
        Describe gantt syntax               :after doc1, 3d
        Add gantt diagram to demo page      : 20h
        Add another diagram to demo page    : 48h
```
Class Diagrams
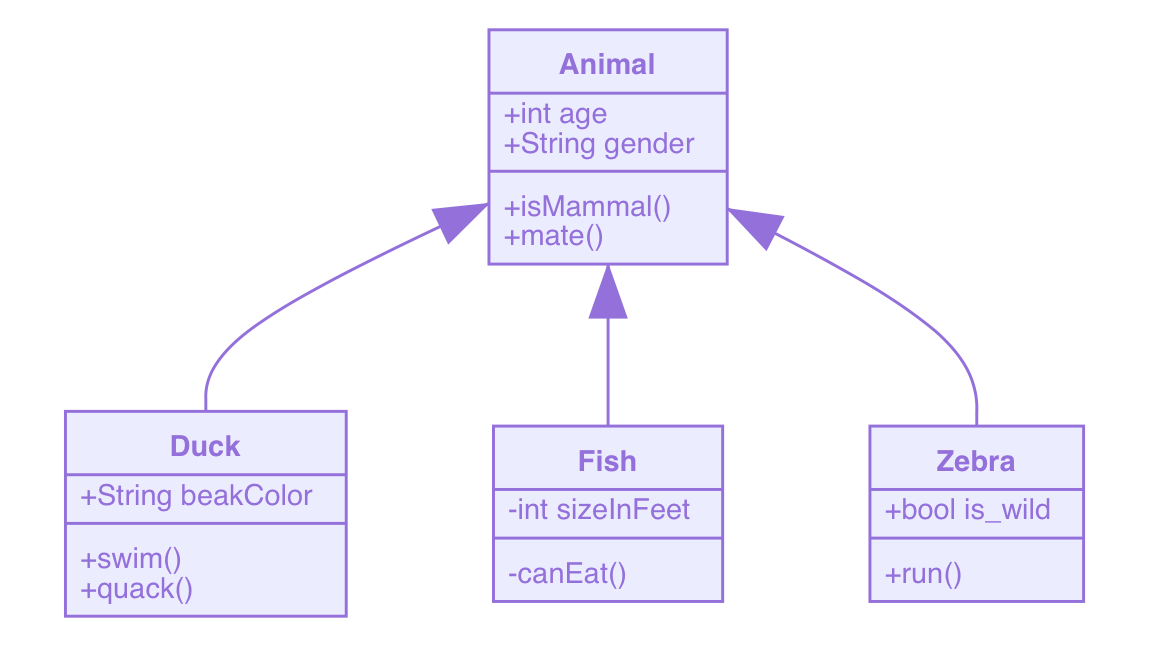
For more details see these instructions.
```mermaid
classDiagram
      Animal <|-- Duck
      Animal <|-- Fish
      Animal <|-- Zebra
      Animal : +int age
      Animal : +String gender
      Animal: +isMammal()
      Animal: +mate()
      class Duck{
          +String beakColor
          +swim()
          +quack()
      }
      class Fish{
          -int sizeInFeet
          -canEat()
      }
      class Zebra{
          +bool is_wild
          +run()
      }
```
State Diagrams
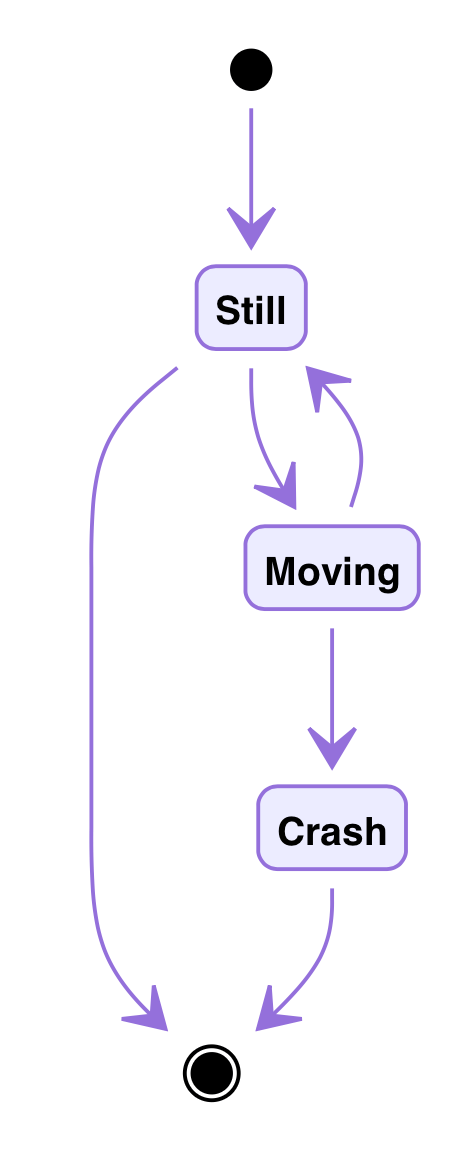
For more details see these instructions.
```mermaid
stateDiagram
    [*] --> Still
    Still --> [*]

    Still --> Moving
    Moving --> Still
    Moving --> Crash
    Crash --> [*]
```
Pie Charts
```mermaid
pie
    title Pie Chart
    "Dogs" : 386
    "Cats" : 85
    "Rats" : 150
```

Requirement Diagram
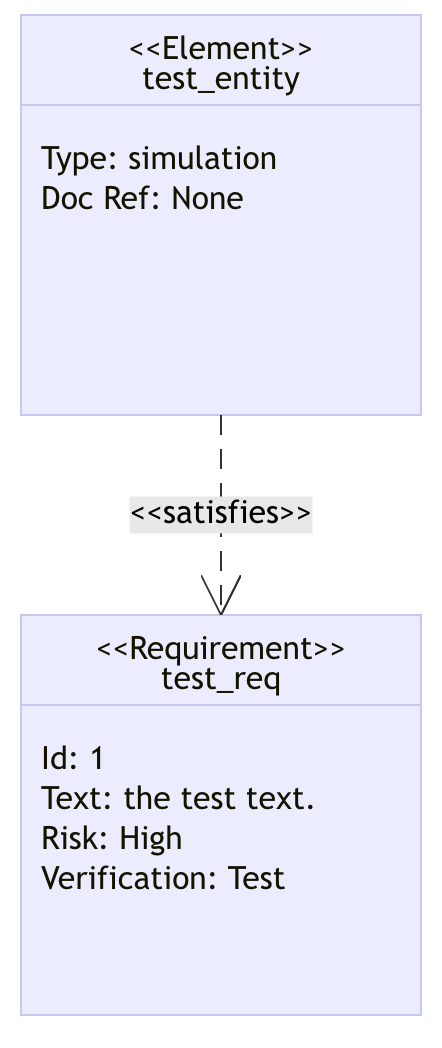
A Requirement diagram provides a visualization for requirements and their connections, to each other and other documented elements. The modeling specs follow those defined by SysML v1.6.
You can find details here.
```mermaid
requirementDiagram

    requirement test_req {
    id: 1
    text: the test text.
    risk: high
    verifymethod: test
    }

    element test_entity {
    type: simulation
    }

    test_entity - satisfies -> test_req
```
Gitgraph Diagrams / Commit Flow
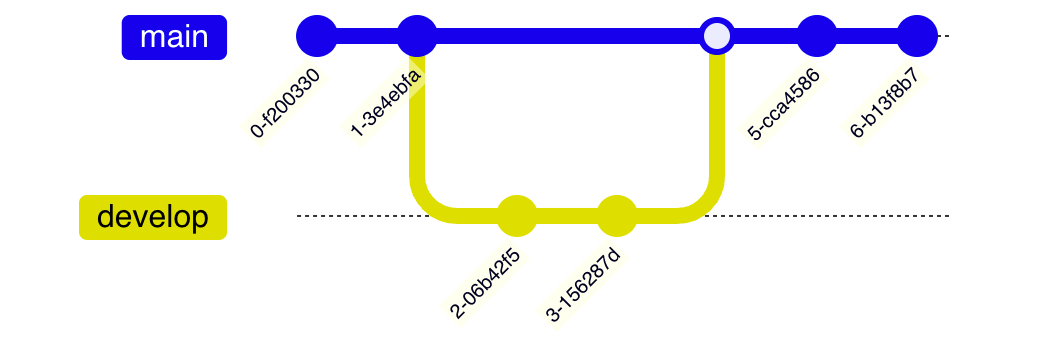
A Git Graph is a pictorial representation of git commits and git actions(commands) on various branches.
You can find details here.
```mermaid
gitGraph
       commit
       commit
       branch develop
       checkout develop
       commit
       commit
       checkout main
       merge develop
       commit
       commit
```
C4 Diagrams (plantUML compatible)
Mermaid’s c4 diagram syntax is compatible with plantUML.
You can find details here.
Mindmap
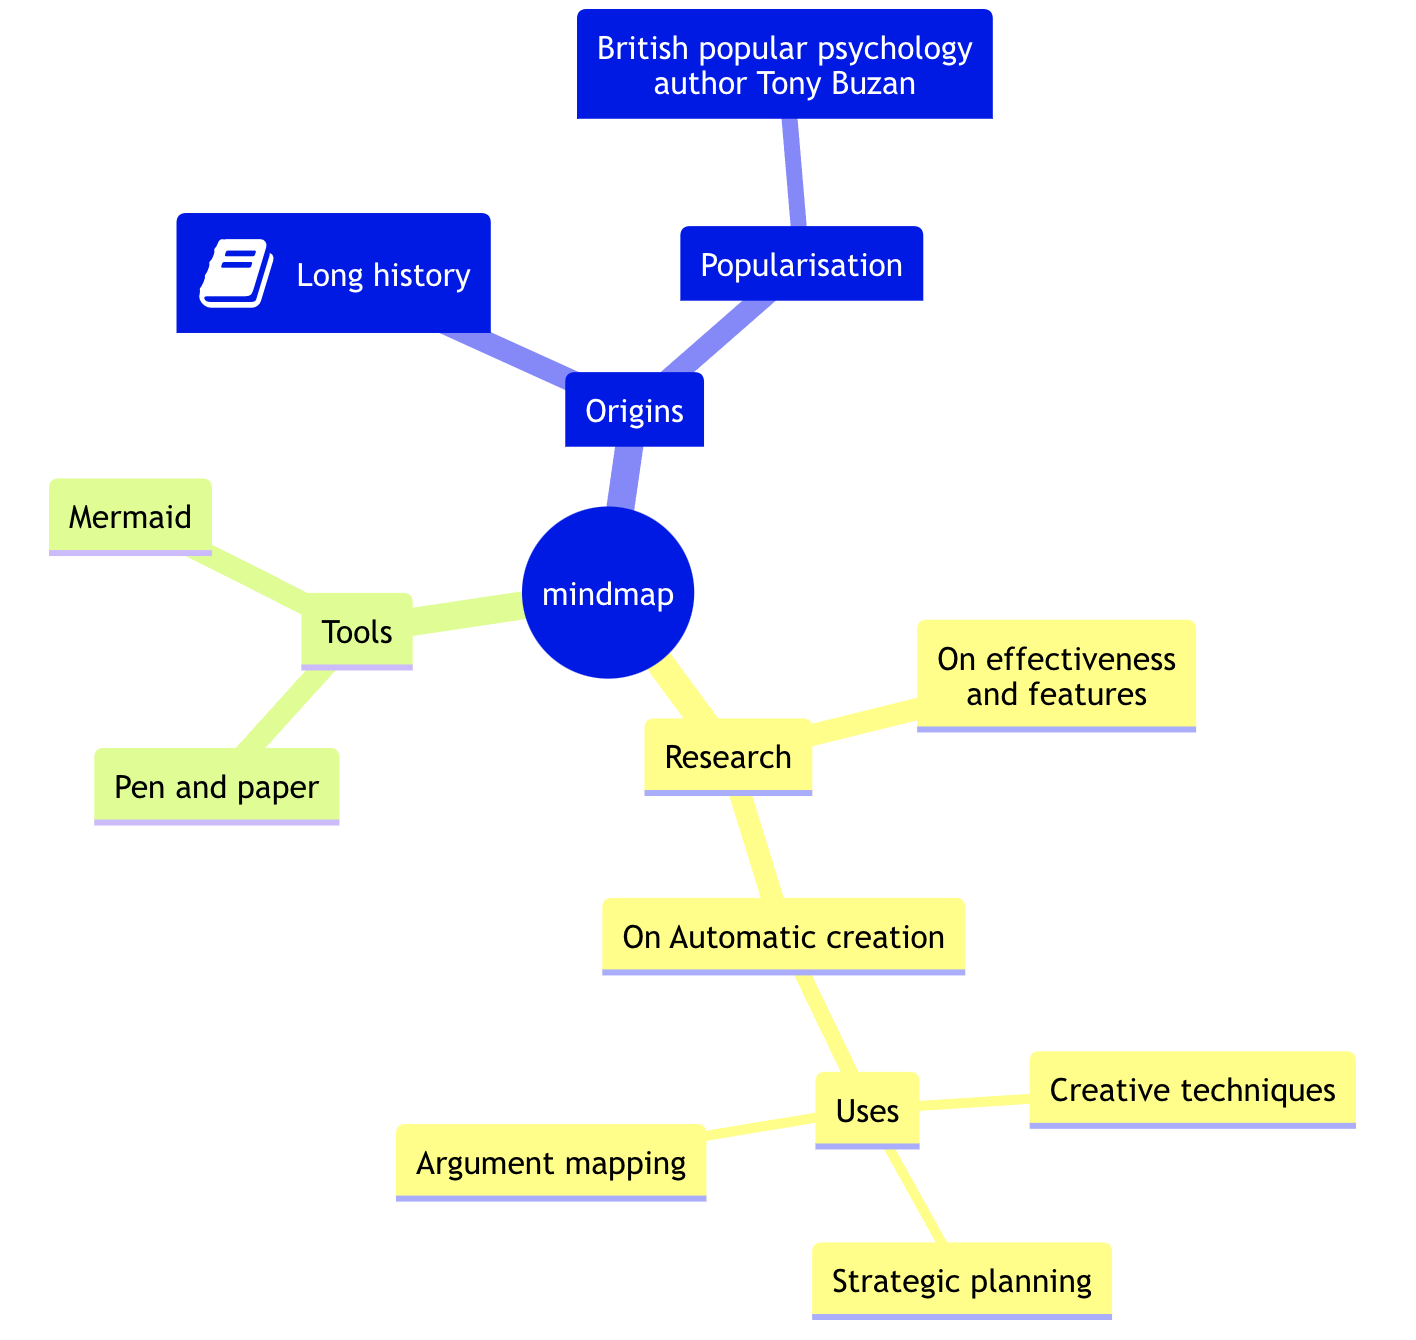
A mind map is a diagram used to visually organize information into a hierarchy, showing relationships among pieces of the whole. It is often created around a single concept, drawn as an image in the center of a blank page, to which associated representations of ideas such as images, words and parts of words are added. Major ideas are connected directly to the central concept, and other ideas branch out from those major ideas.
You can find details here.
```mermaid
mindmap
  root((mindmap))
    Origins
      Long history
      ::icon(fa fa-book)
      Popularisation
        British popular psychology author Tony Buzan
    Research
      On effectiveness<br/>and features
      On Automatic creation
        Uses
            Creative techniques
            Strategic planning
            Argument mapping
    Tools
      Pen and paper
      Mermaid
```
Timeline
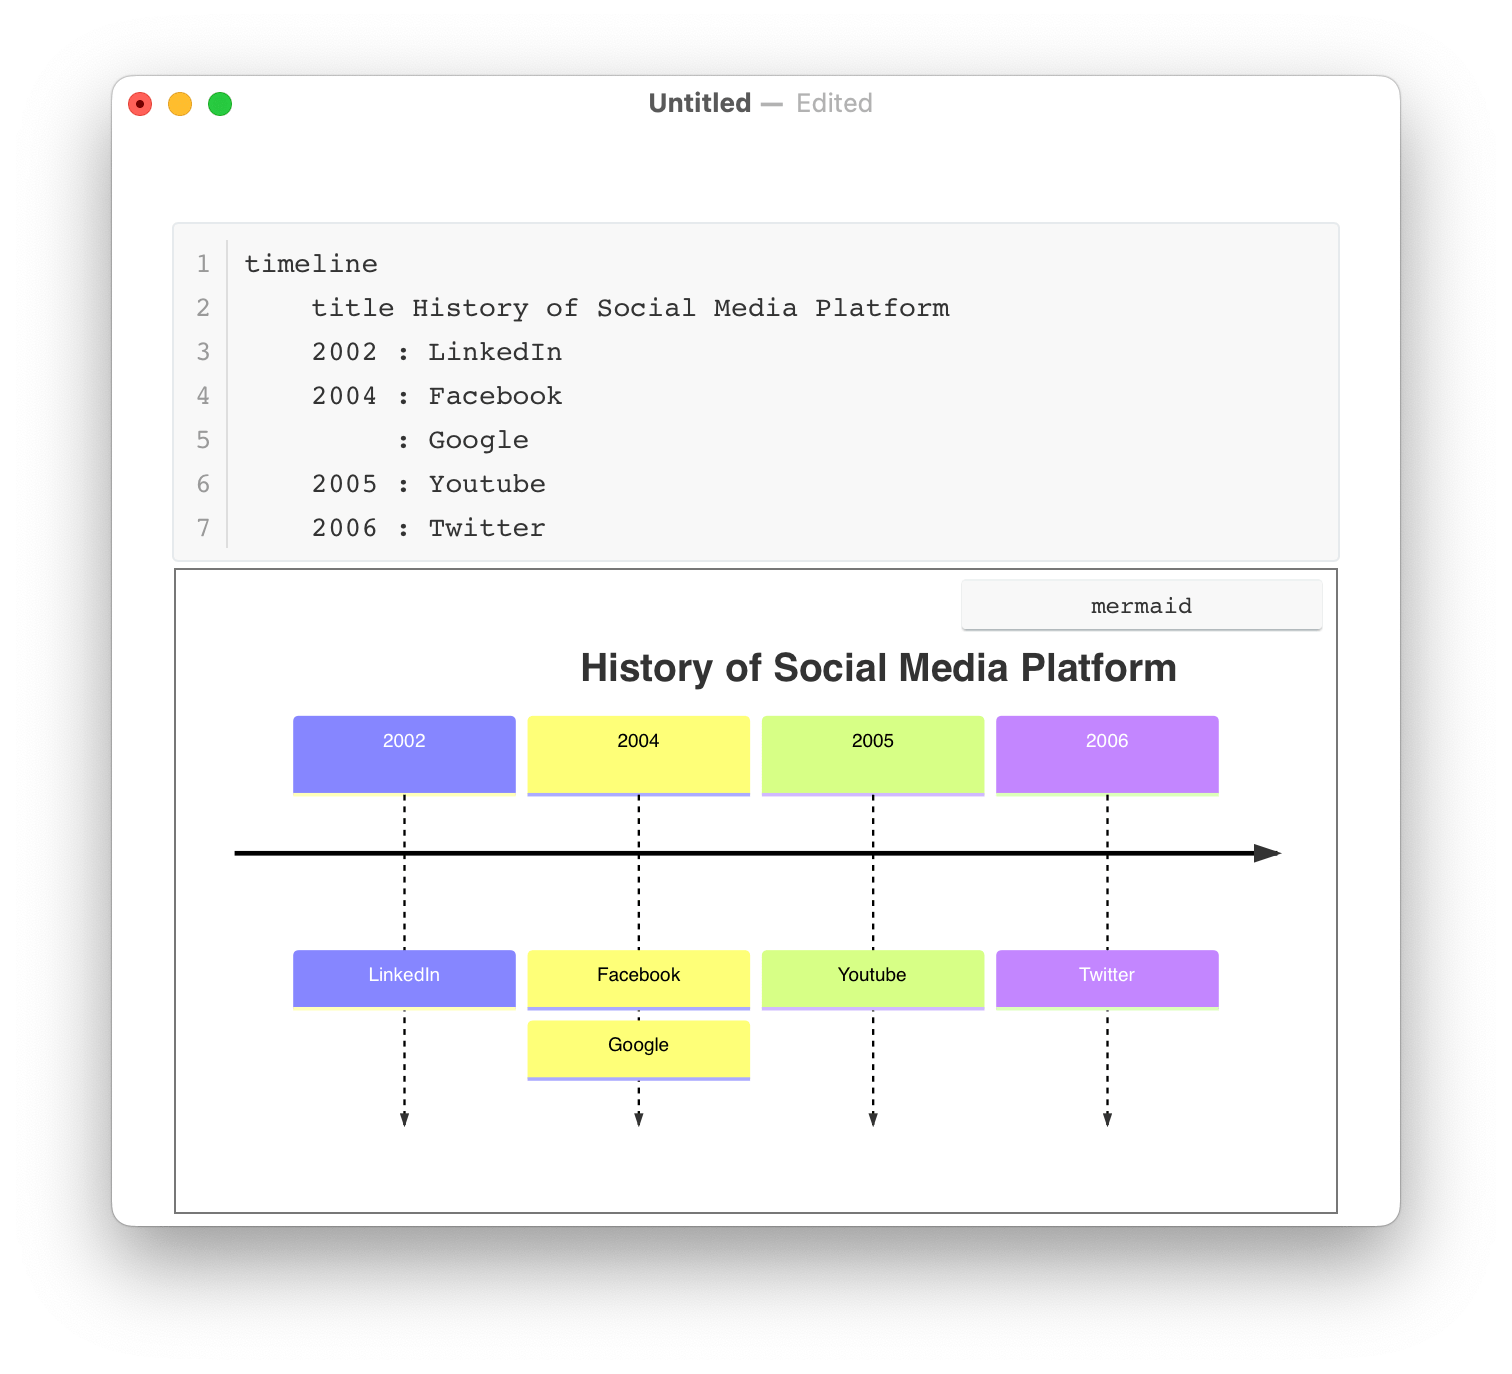
See https://mermaid.js.org/syntax/timeline.html for detail.
Quadrant Chart
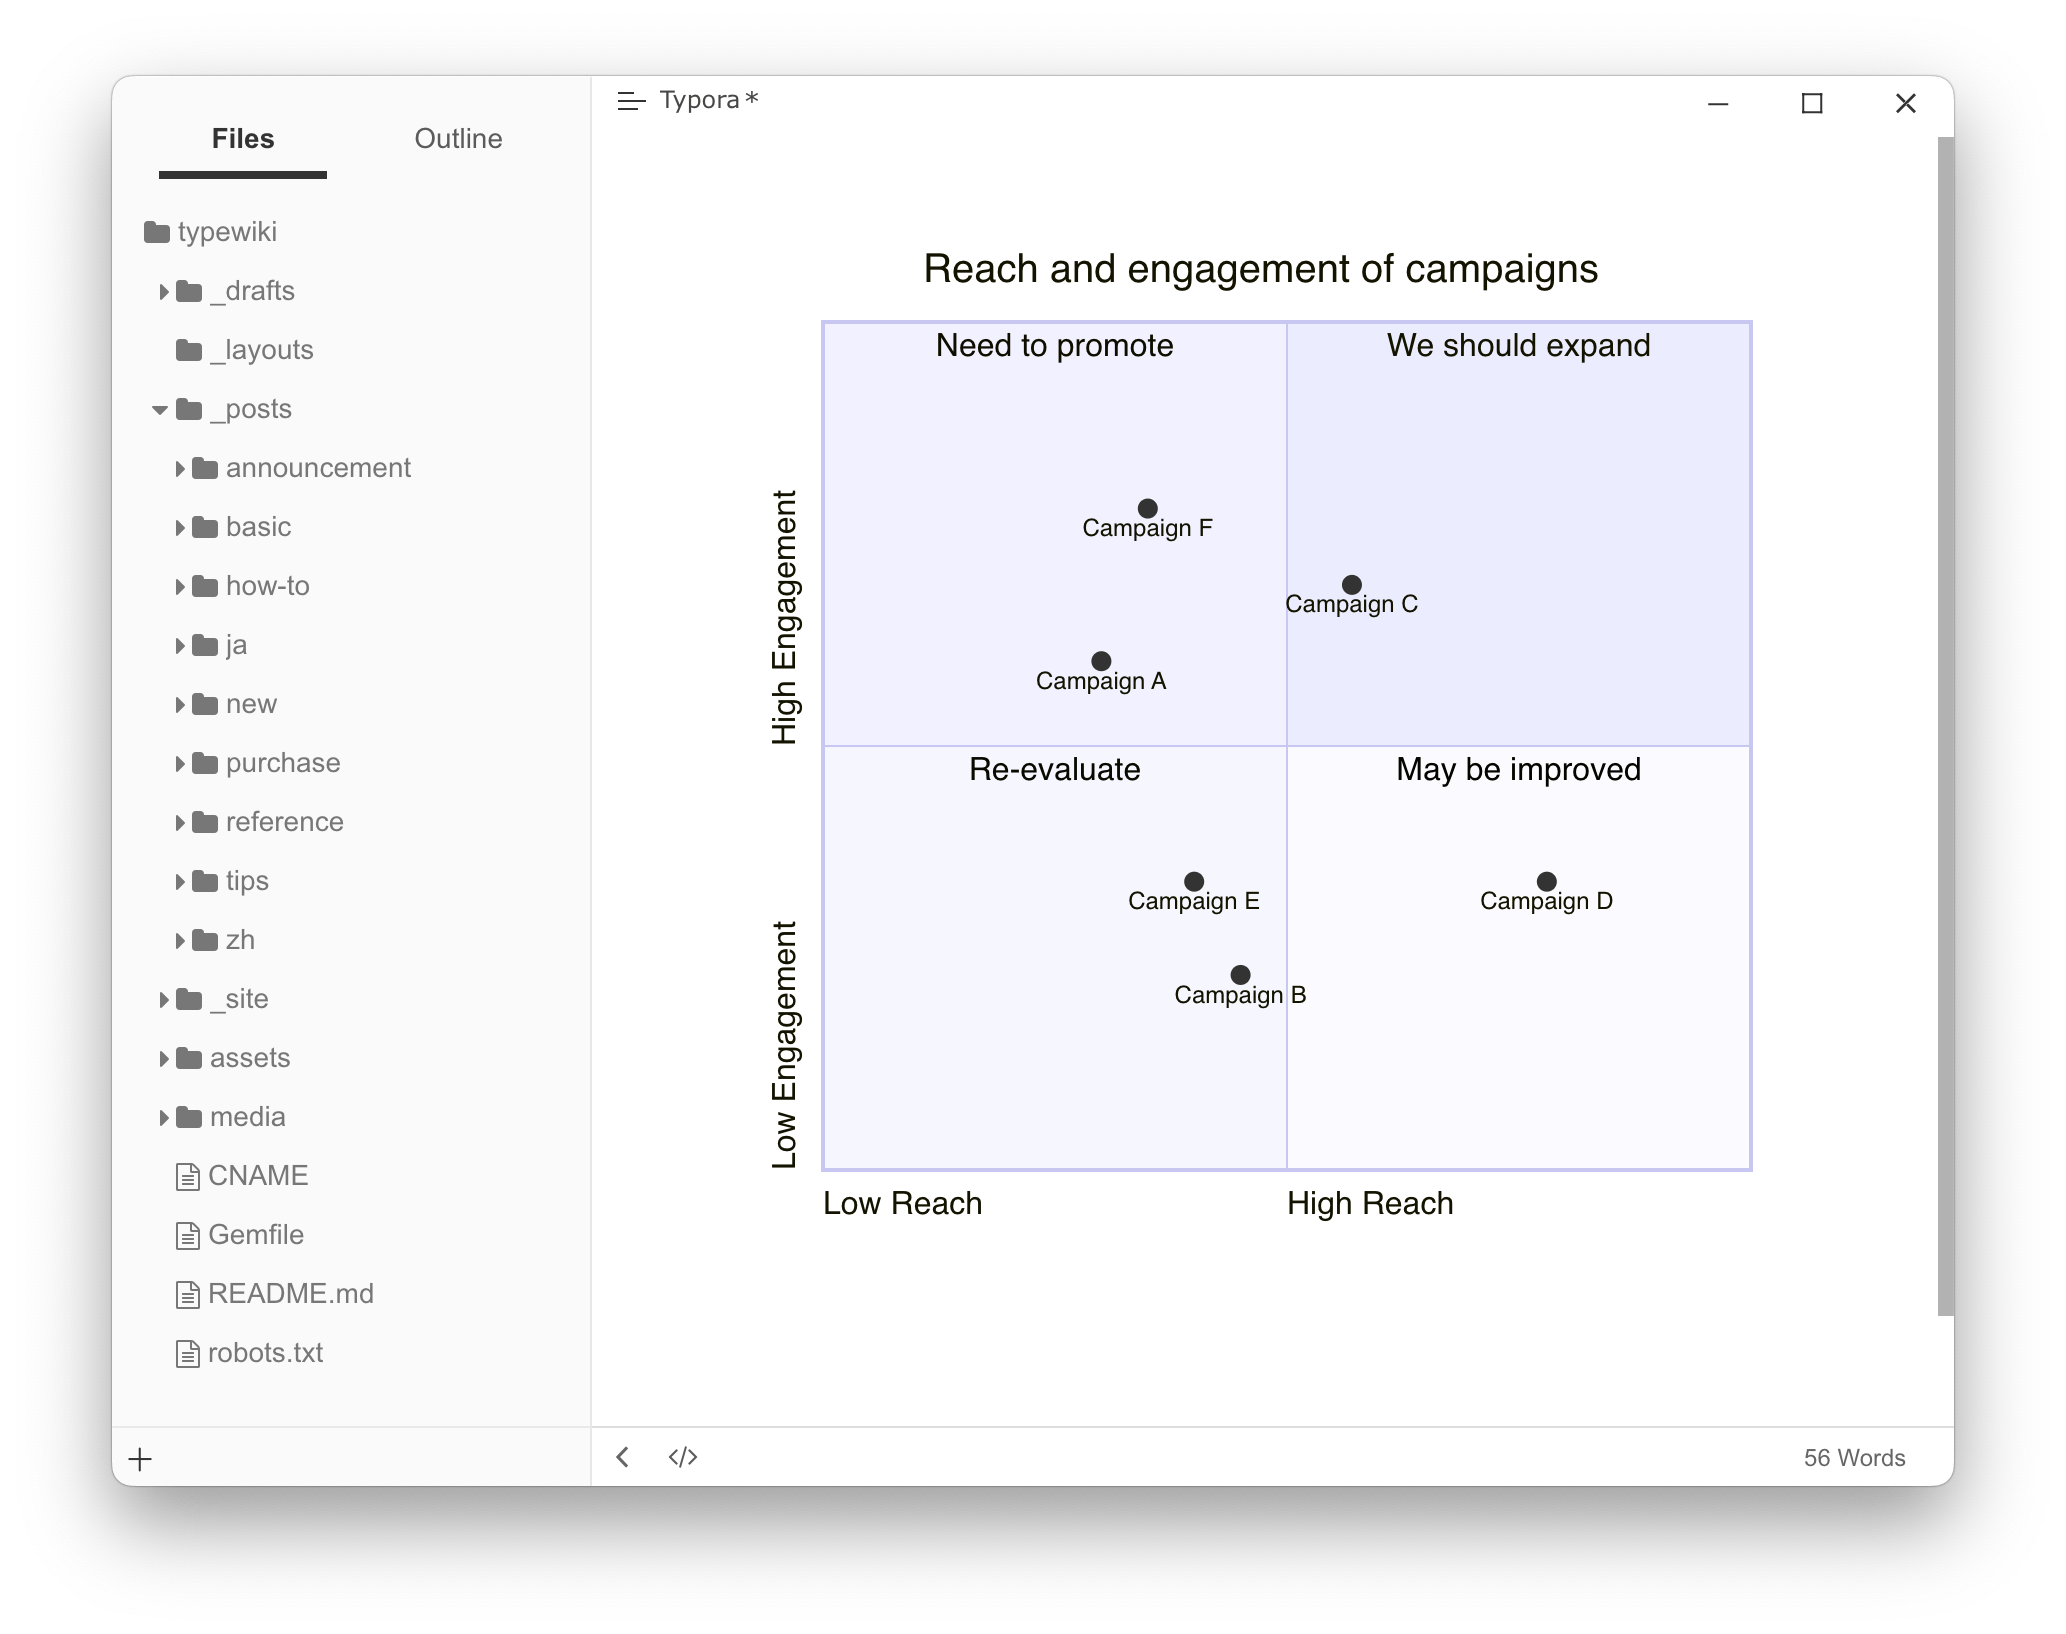
See https://mermaid.js.org/syntax/quadrantChart.html for details.
Sankey diagrams
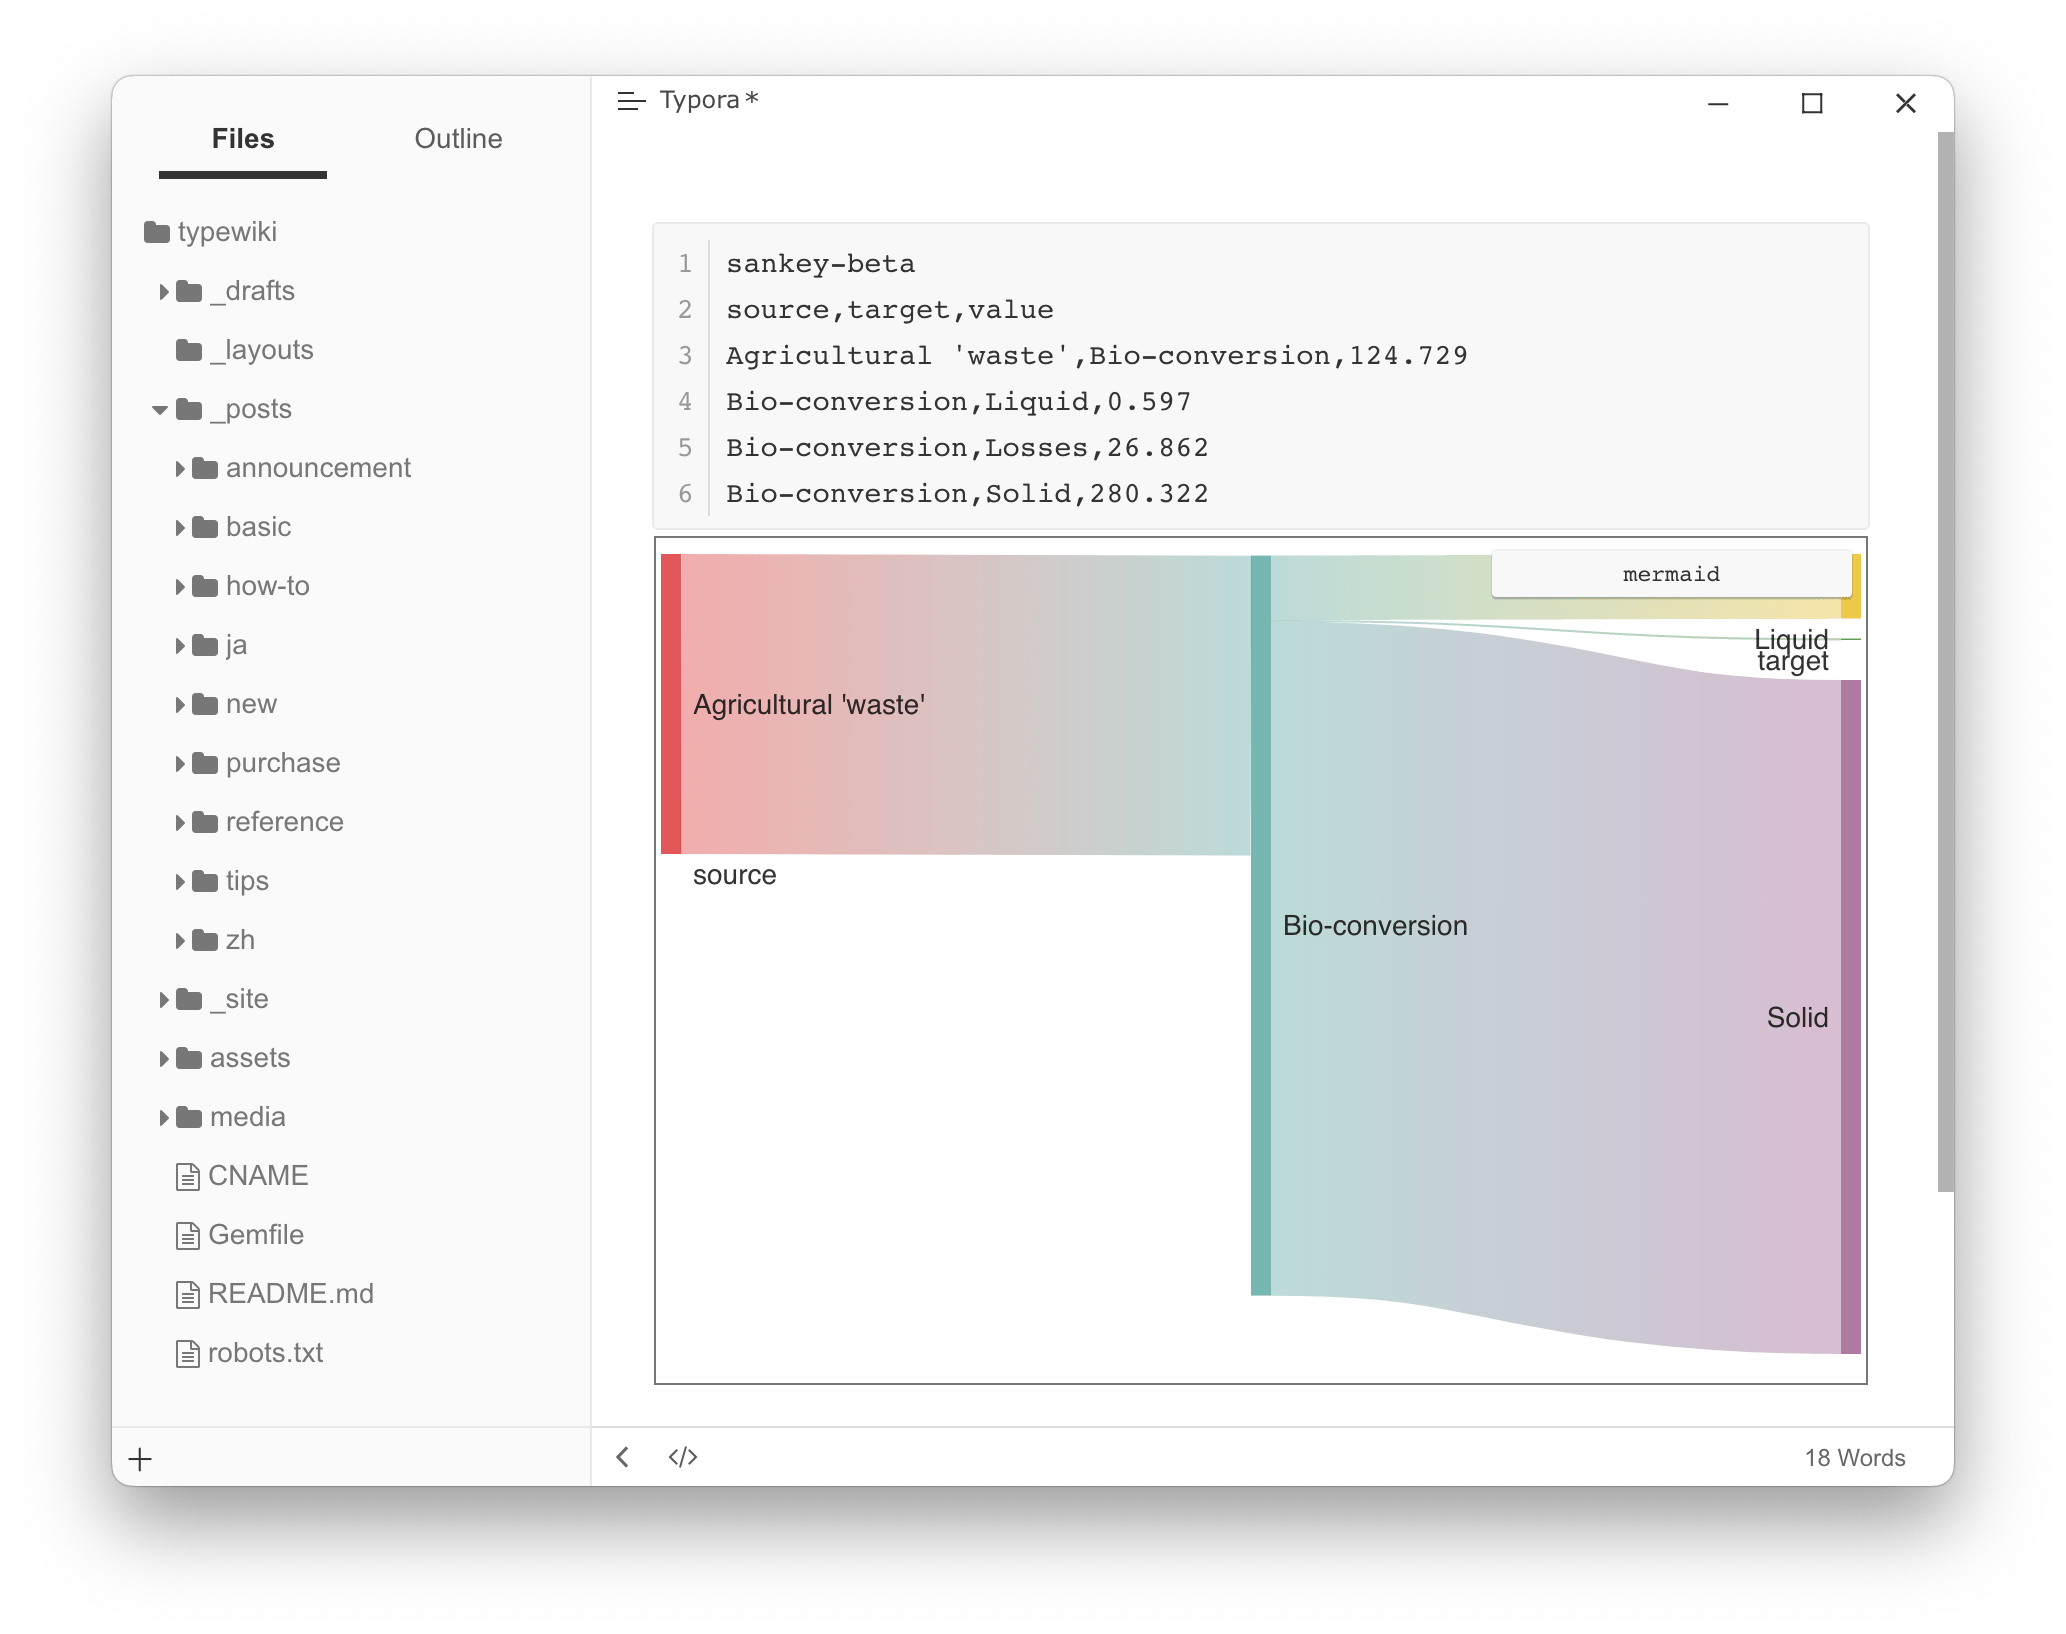
See https://mermaid.js.org/syntax/sankey.html for details.
ZenUML
See https://mermaid.js.org/syntax/zenuml.html for details.
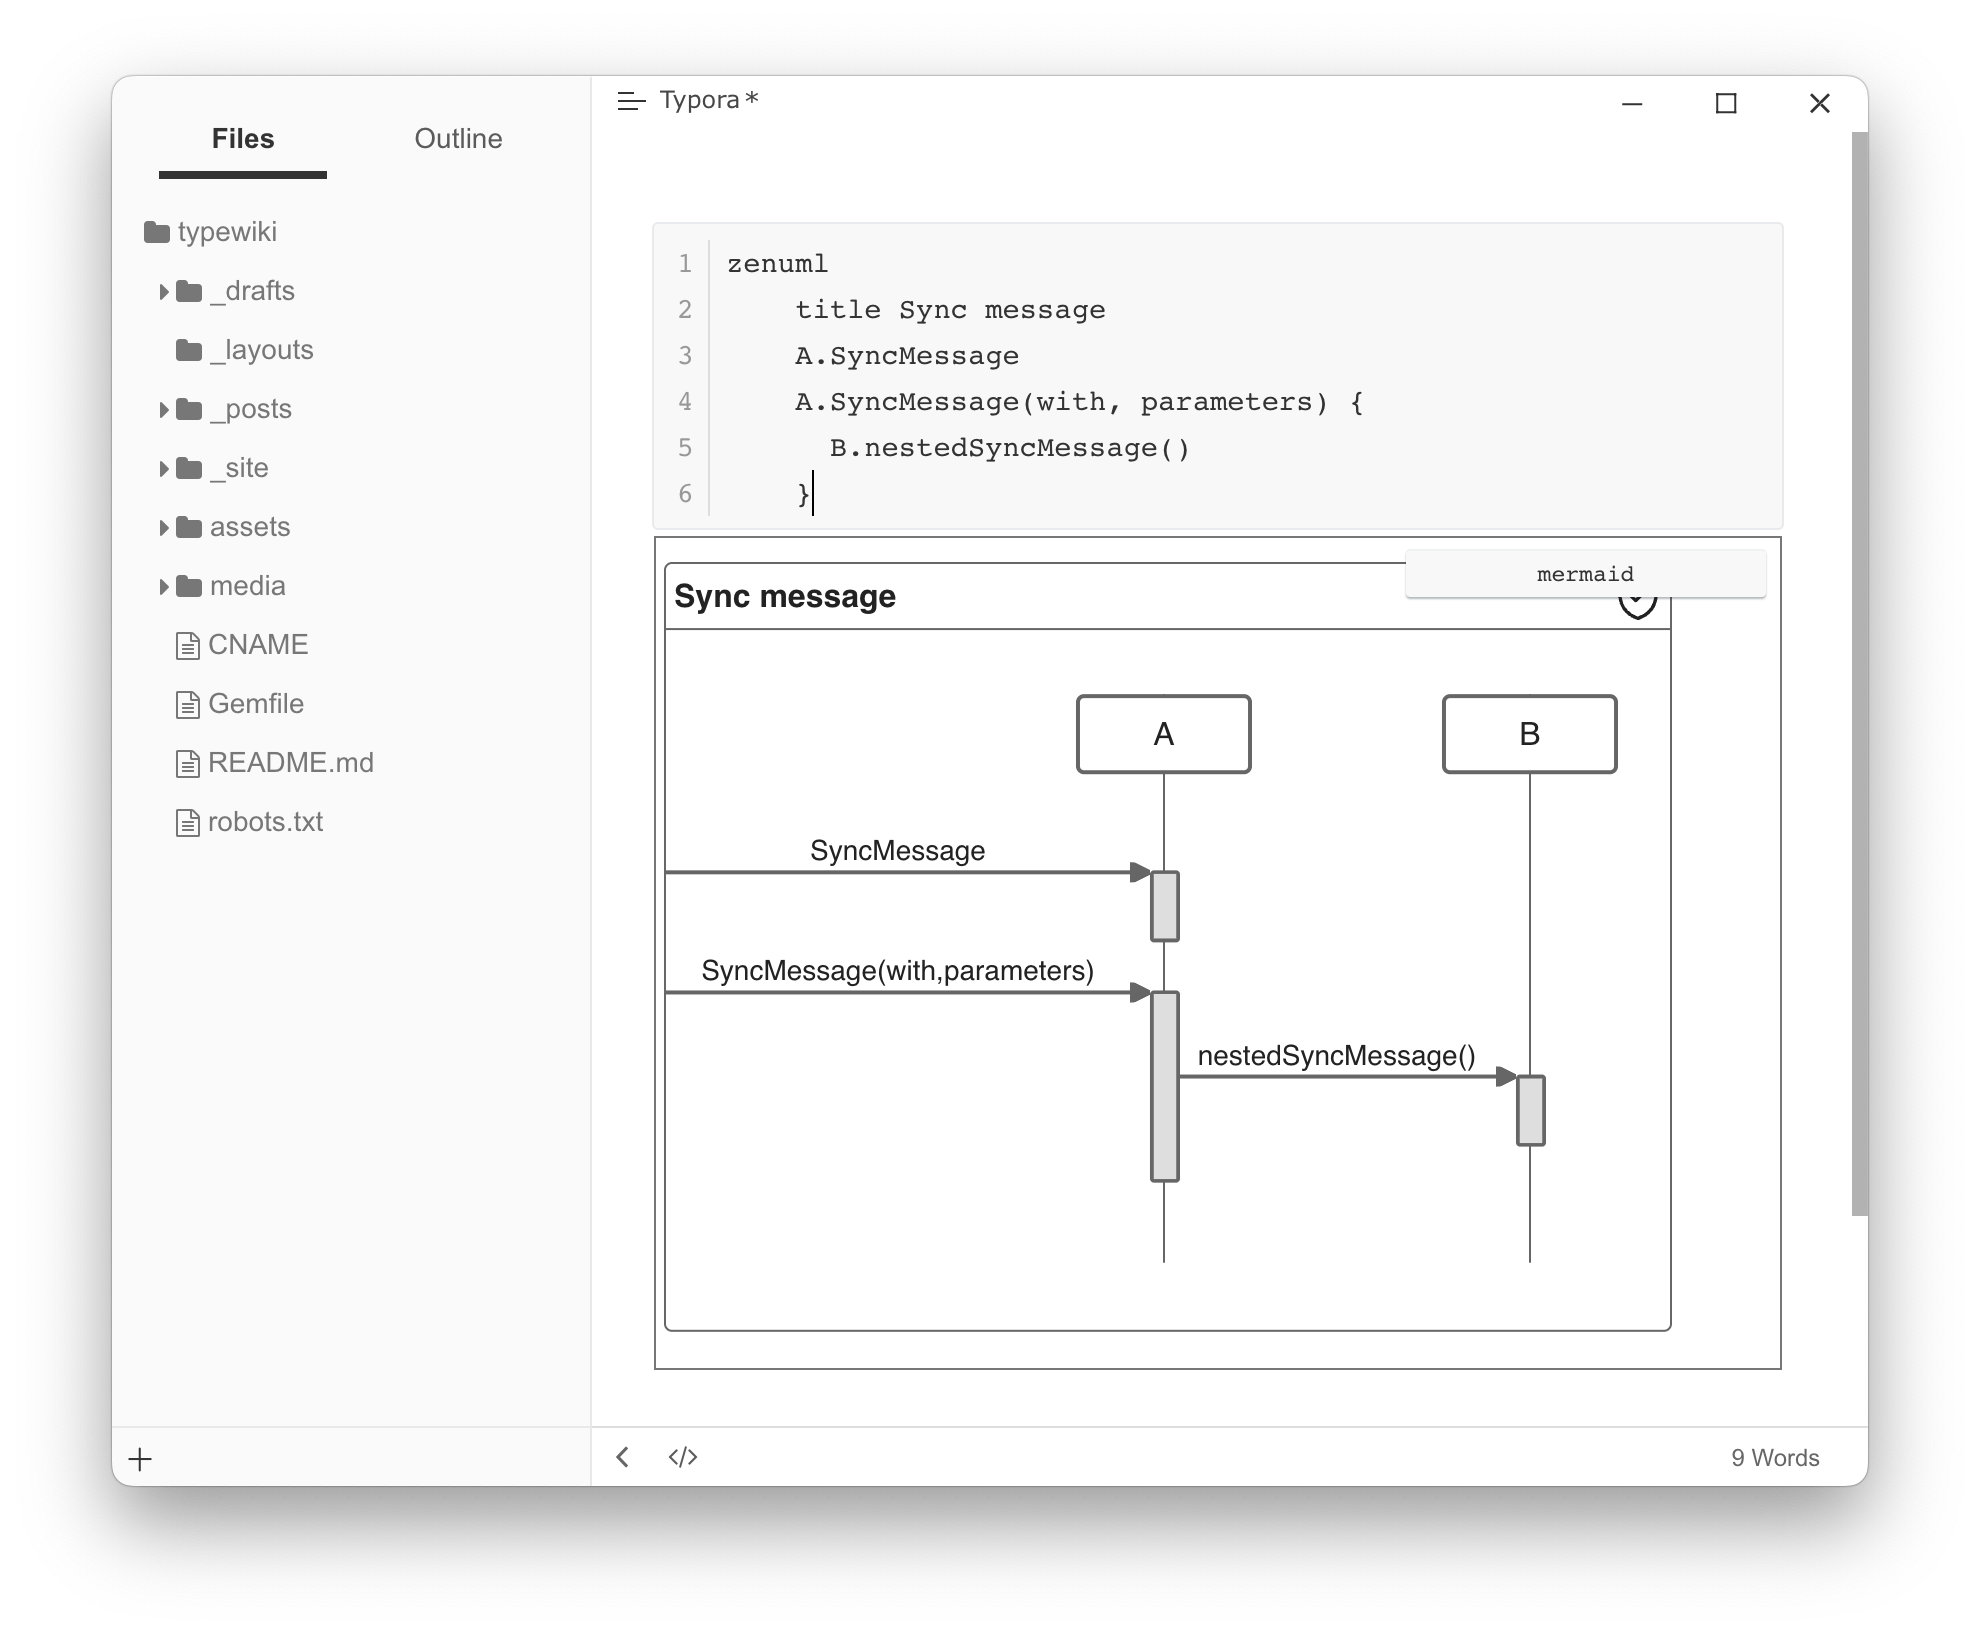
Please notice that zenuml is not first class diagram in mermaid, it may lack some features, like dark themes, etc.
XY Chart
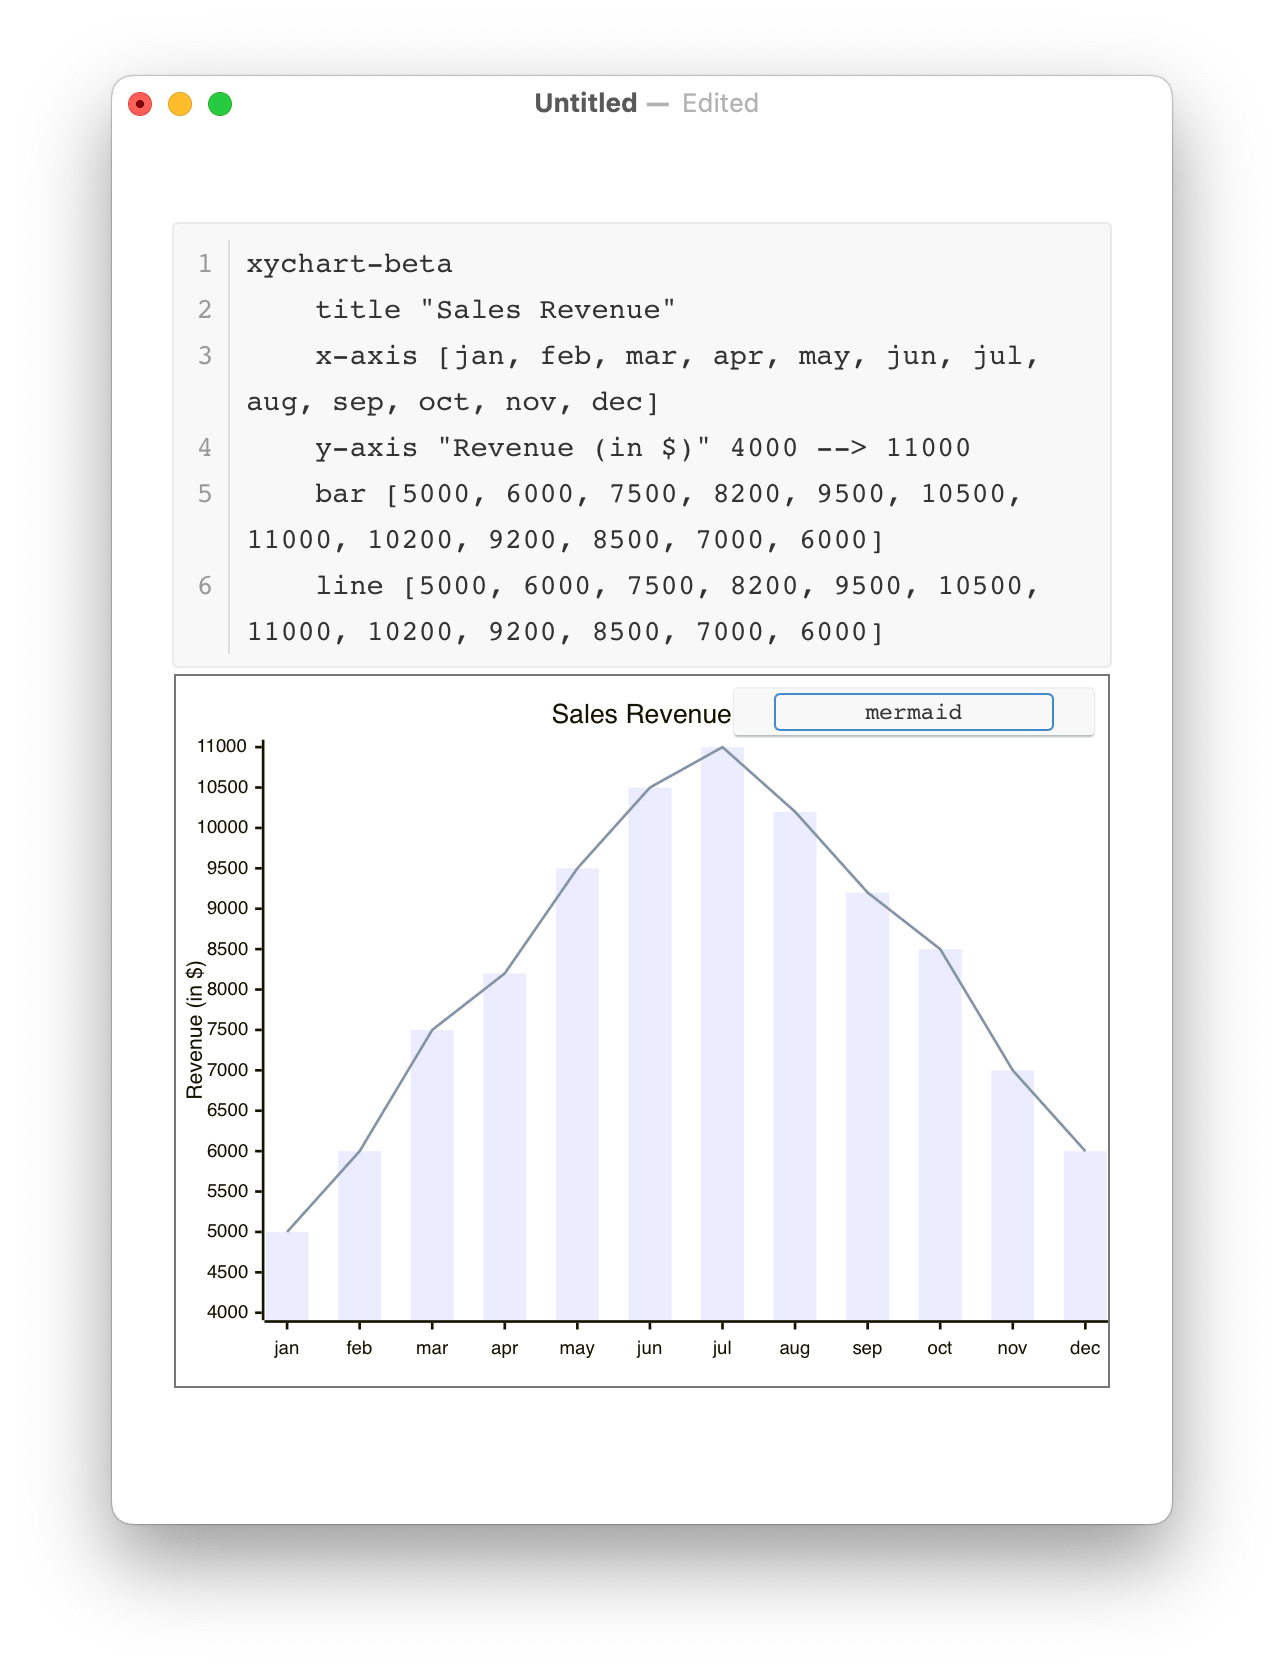
You can find more details here → https://mermaid.js.org/syntax/xyChart.html.
You can now draw charts like this:
Global Mermaid Options
Overview
You can change Mermaid options by adding Custom CSS, supported options include:
:root {
  --mermaid-theme: default; /*or base, dark, forest, neutral, night */
  --mermaid-font-family: "trebuchet ms", verdana, arial, sans-serif;
  --mermaid-sequence-numbers: off; /* or "on", see https://mermaid-js.github.io/mermaid/#/sequenceDiagram?id=sequencenumbers*/
  --mermaid-flowchart-curve: linear /* or "basis", see https://github.com/typora/typora-issues/issues/1632*/;
  --mermaid--gantt-left-padding: 75; /* see https://github.com/typora/typora-issues/issues/1665*/
}
Please note that if you export a document with themes other than the currently used one, some mermaid options will not be applied to exported HTML / PDF / Images. For example, if you currently use the Github theme, then export to PDF using the theme YYY and YYY.css defines --mermaid-sequence-numbers: on, then the --mermaid-sequence-numbers: on would not be applied to the exported PDF.
Diagram Alignment
You can add the custom CSS below by following Add Custom CSS to left align your diagram.
.md-diagram-panel-preview {text-align:left;}
Mermaid Theme
The --mermaid-theme css variable can quickly define a mermaid theme that fits your theme, the value can be base, default, dark, forest, neutral or night (the one used in night theme), for example:
| CSS | Mermaid Demo |
|---|---|
:root {--mermaid-theme:dark;} |
 |
:root {--mermaid-theme:neutral;} |
 |
:root {--mermaid-theme:forest;} |
 |
Auto Numbering
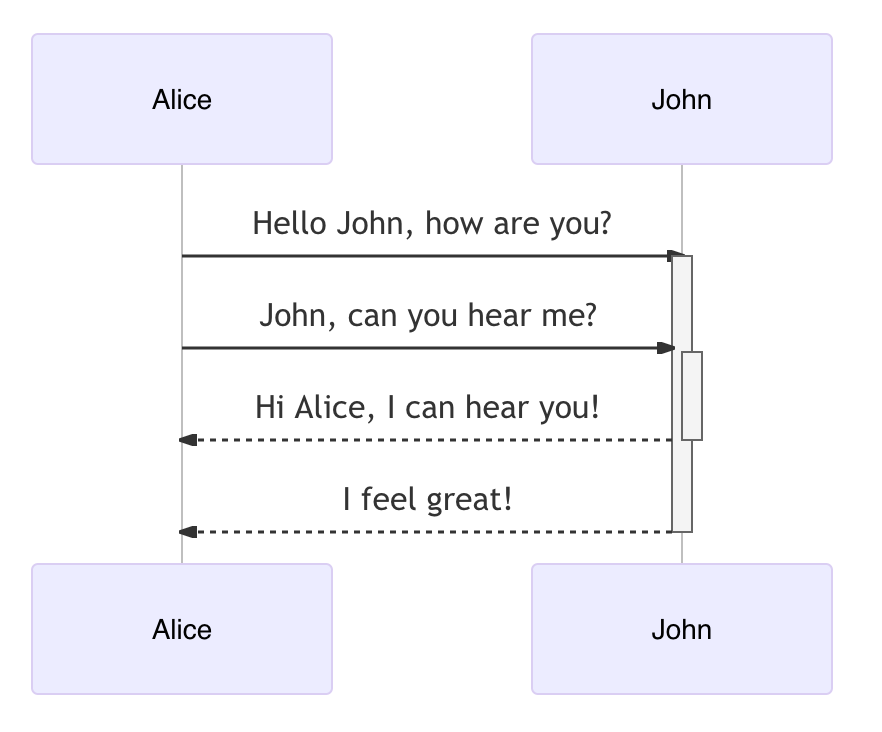
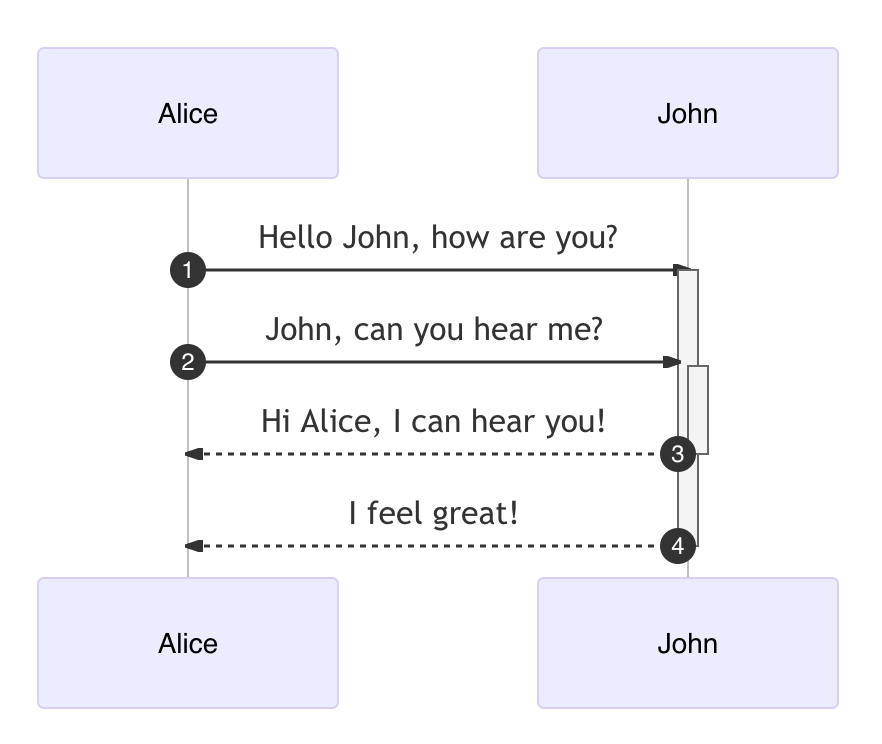
Adding --mermaid-sequence-numbers: on; in the Custom CSS will enable auto numbering for sequences in mermaid:
| –mermaid-sequence-numbers:off | –mermaid-sequence-numbers:on |
|---|---|
 |
 |
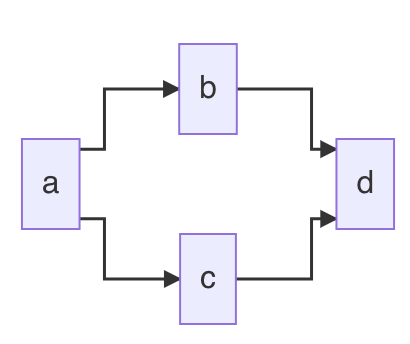
Flowchart Curve
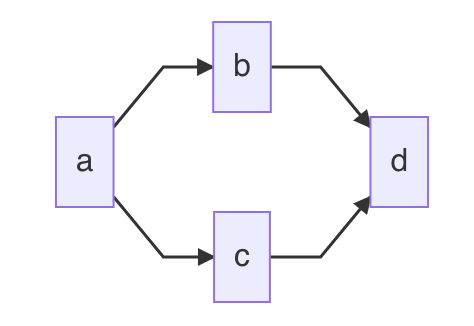
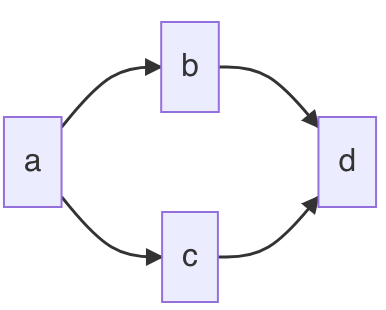
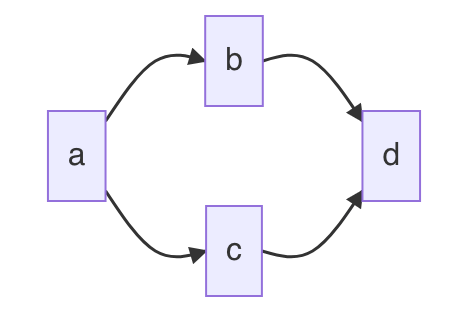
Add --mermaid-flowchart-curve: basis to get other type of curves.
| –mermaid-flowchart-curve: linear; | –mermaid-flowchart-curve: basis | –mermaid-flowchart-curve: natural; | –mermaid-flowchart-curve: step; |
|---|---|---|---|
 |
 |
 |
 |
Gantt Padding
| –mermaid–gantt-left-padding:75 | –mermaid–gantt-left-padding:200 |
|---|---|
 |
 |
Inline Mermaid Config
You can add %%{init: [options]}%% to the first line of your mermaid diagram to configure mermaid details as shown below:
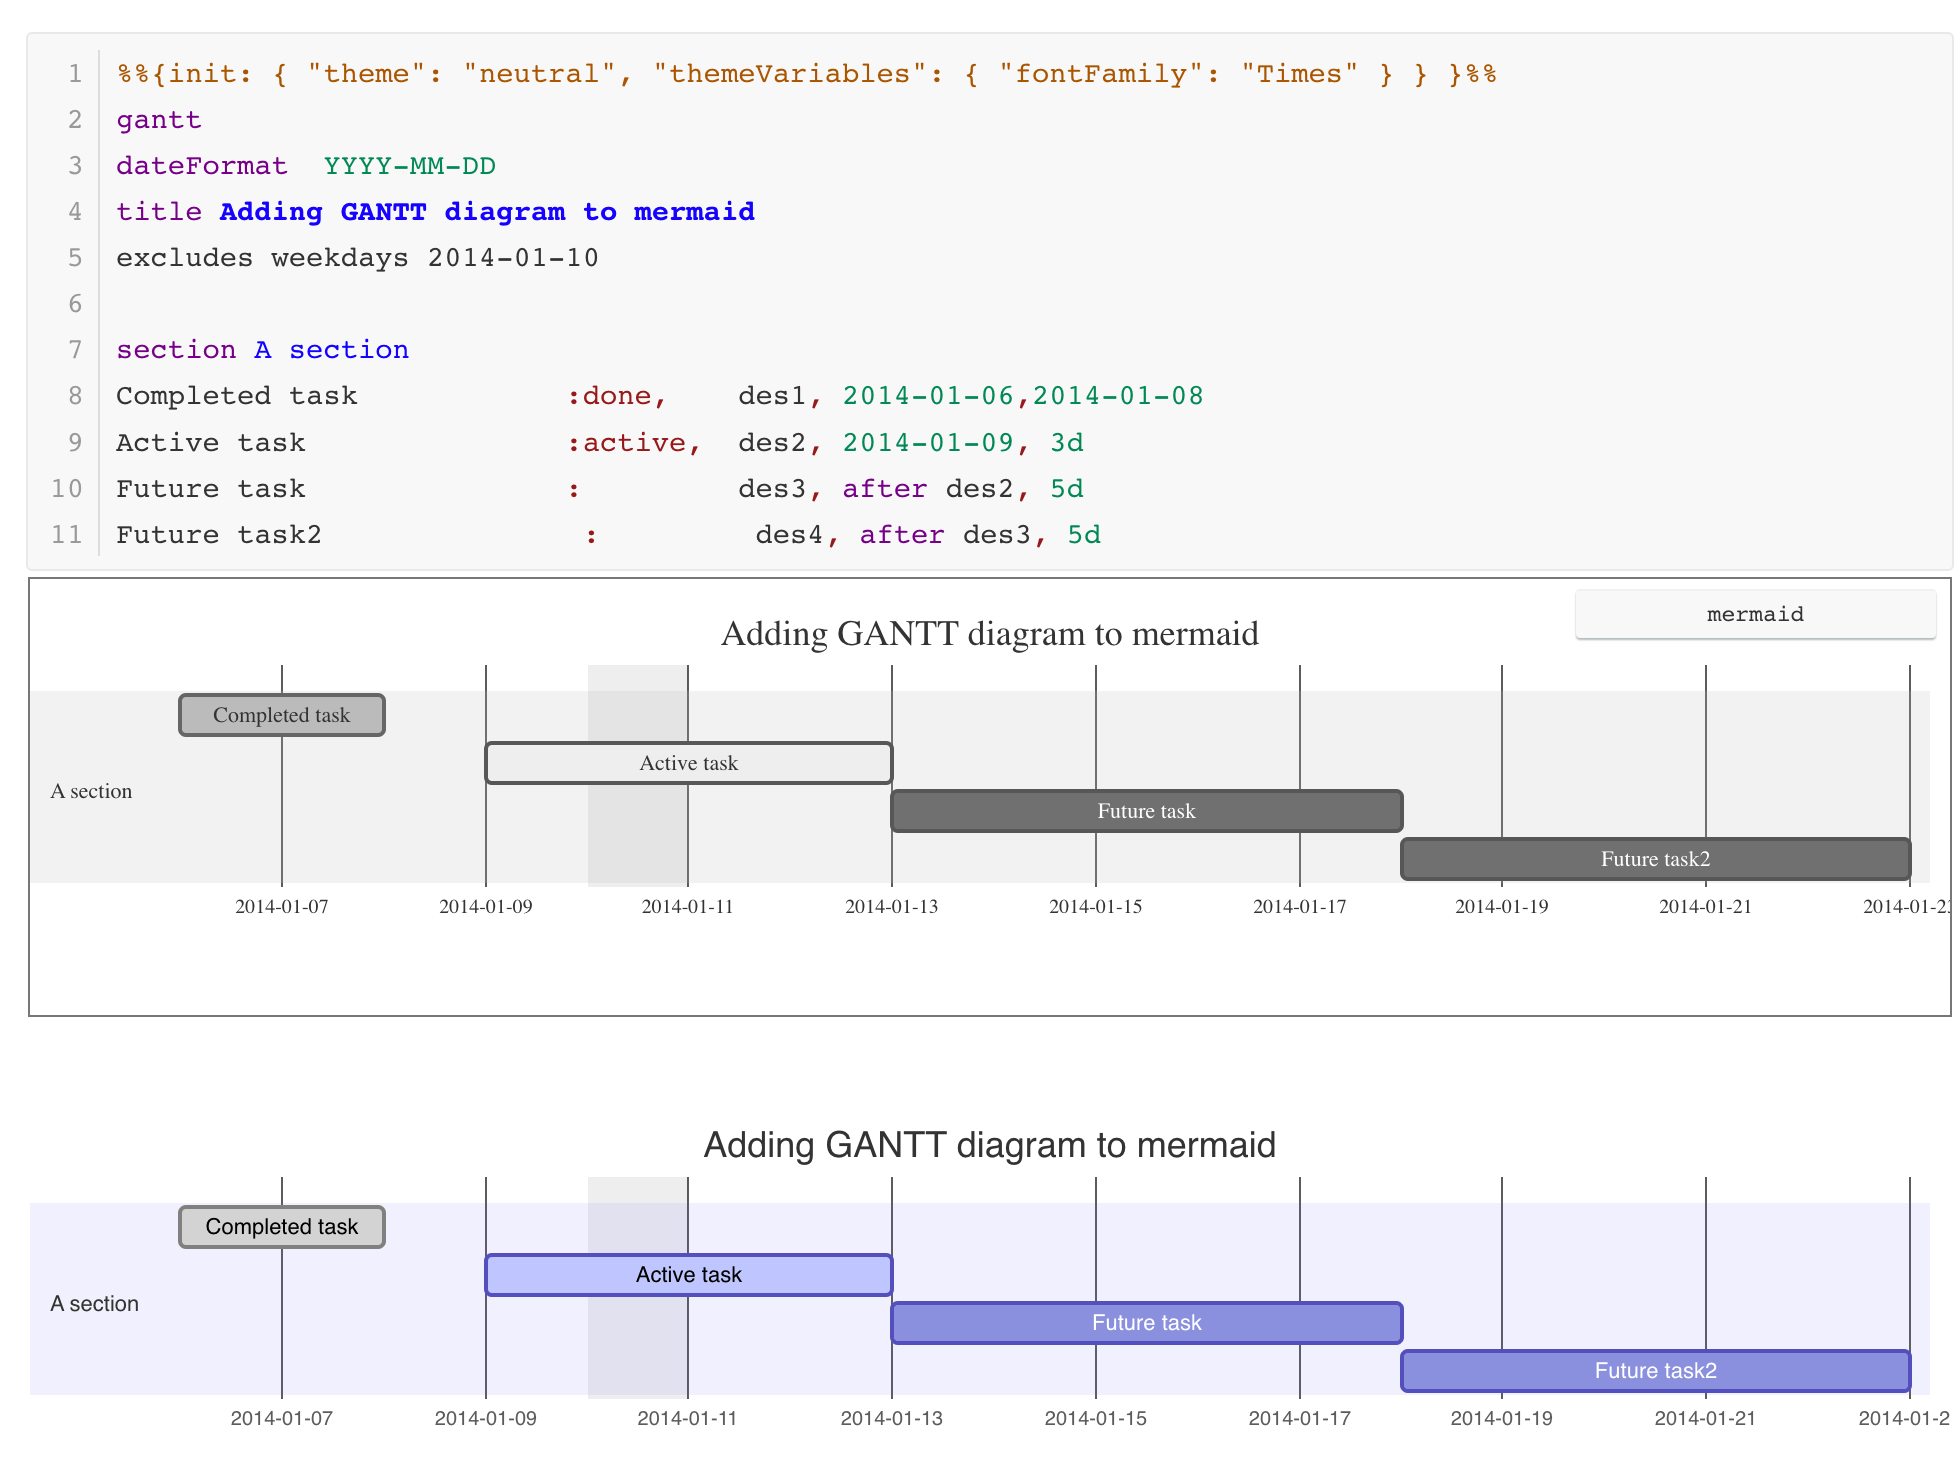
You can find full documentation at https://mermaid-js.github.io/mermaid/#/./directives.
Save-as / Copy on Diagrams
You can right click on a diagram to save it as a SVG, PNG or JPG file on your local disk.
Also, you can right click on a diagram to copy it to your clipboard.